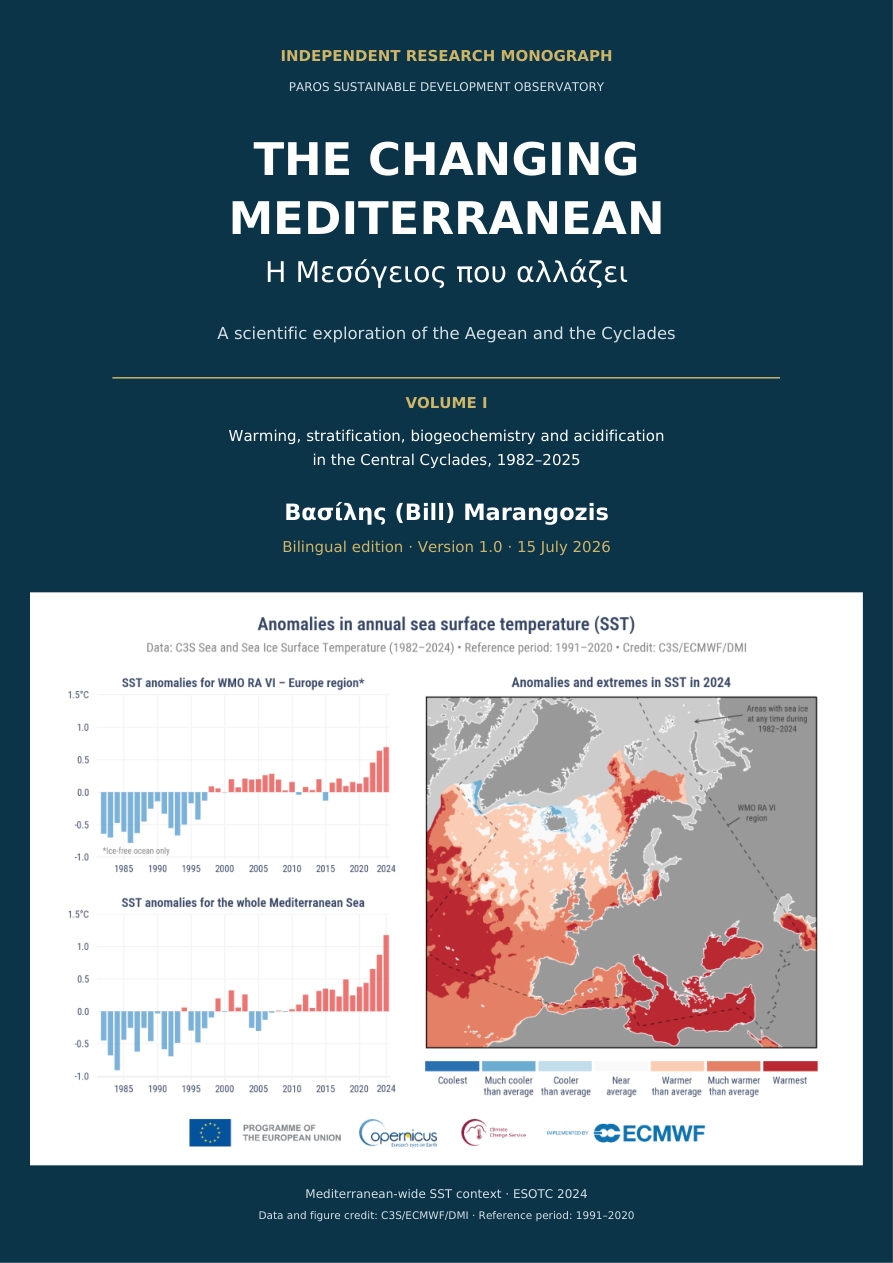
01 · What the study examines
The analysis combines a satellite sea-surface-temperature record for a marine window around Paros–Antiparos (1982–2025), a physical reanalysis (1987–2025), and a biogeochemical reanalysis (1999–2025). Reanalyses combine numerical models with available observations; their outputs are not a continuous record of local field measurements.
The deep-water analysis uses a common 0–300 m footprint within 75 km of Paros: 184 model cells, covering approximately 3,156 km² across nine disconnected deep basins. The nearest cell is about 40 km from the centre of Paros. Its findings therefore cannot be treated as measurements from the island’s shallow bays. Physical anomalies generally use 1991–2020 as their reference; biogeochemical anomalies use 2000–2019.
02 · Warming reaches below the surface
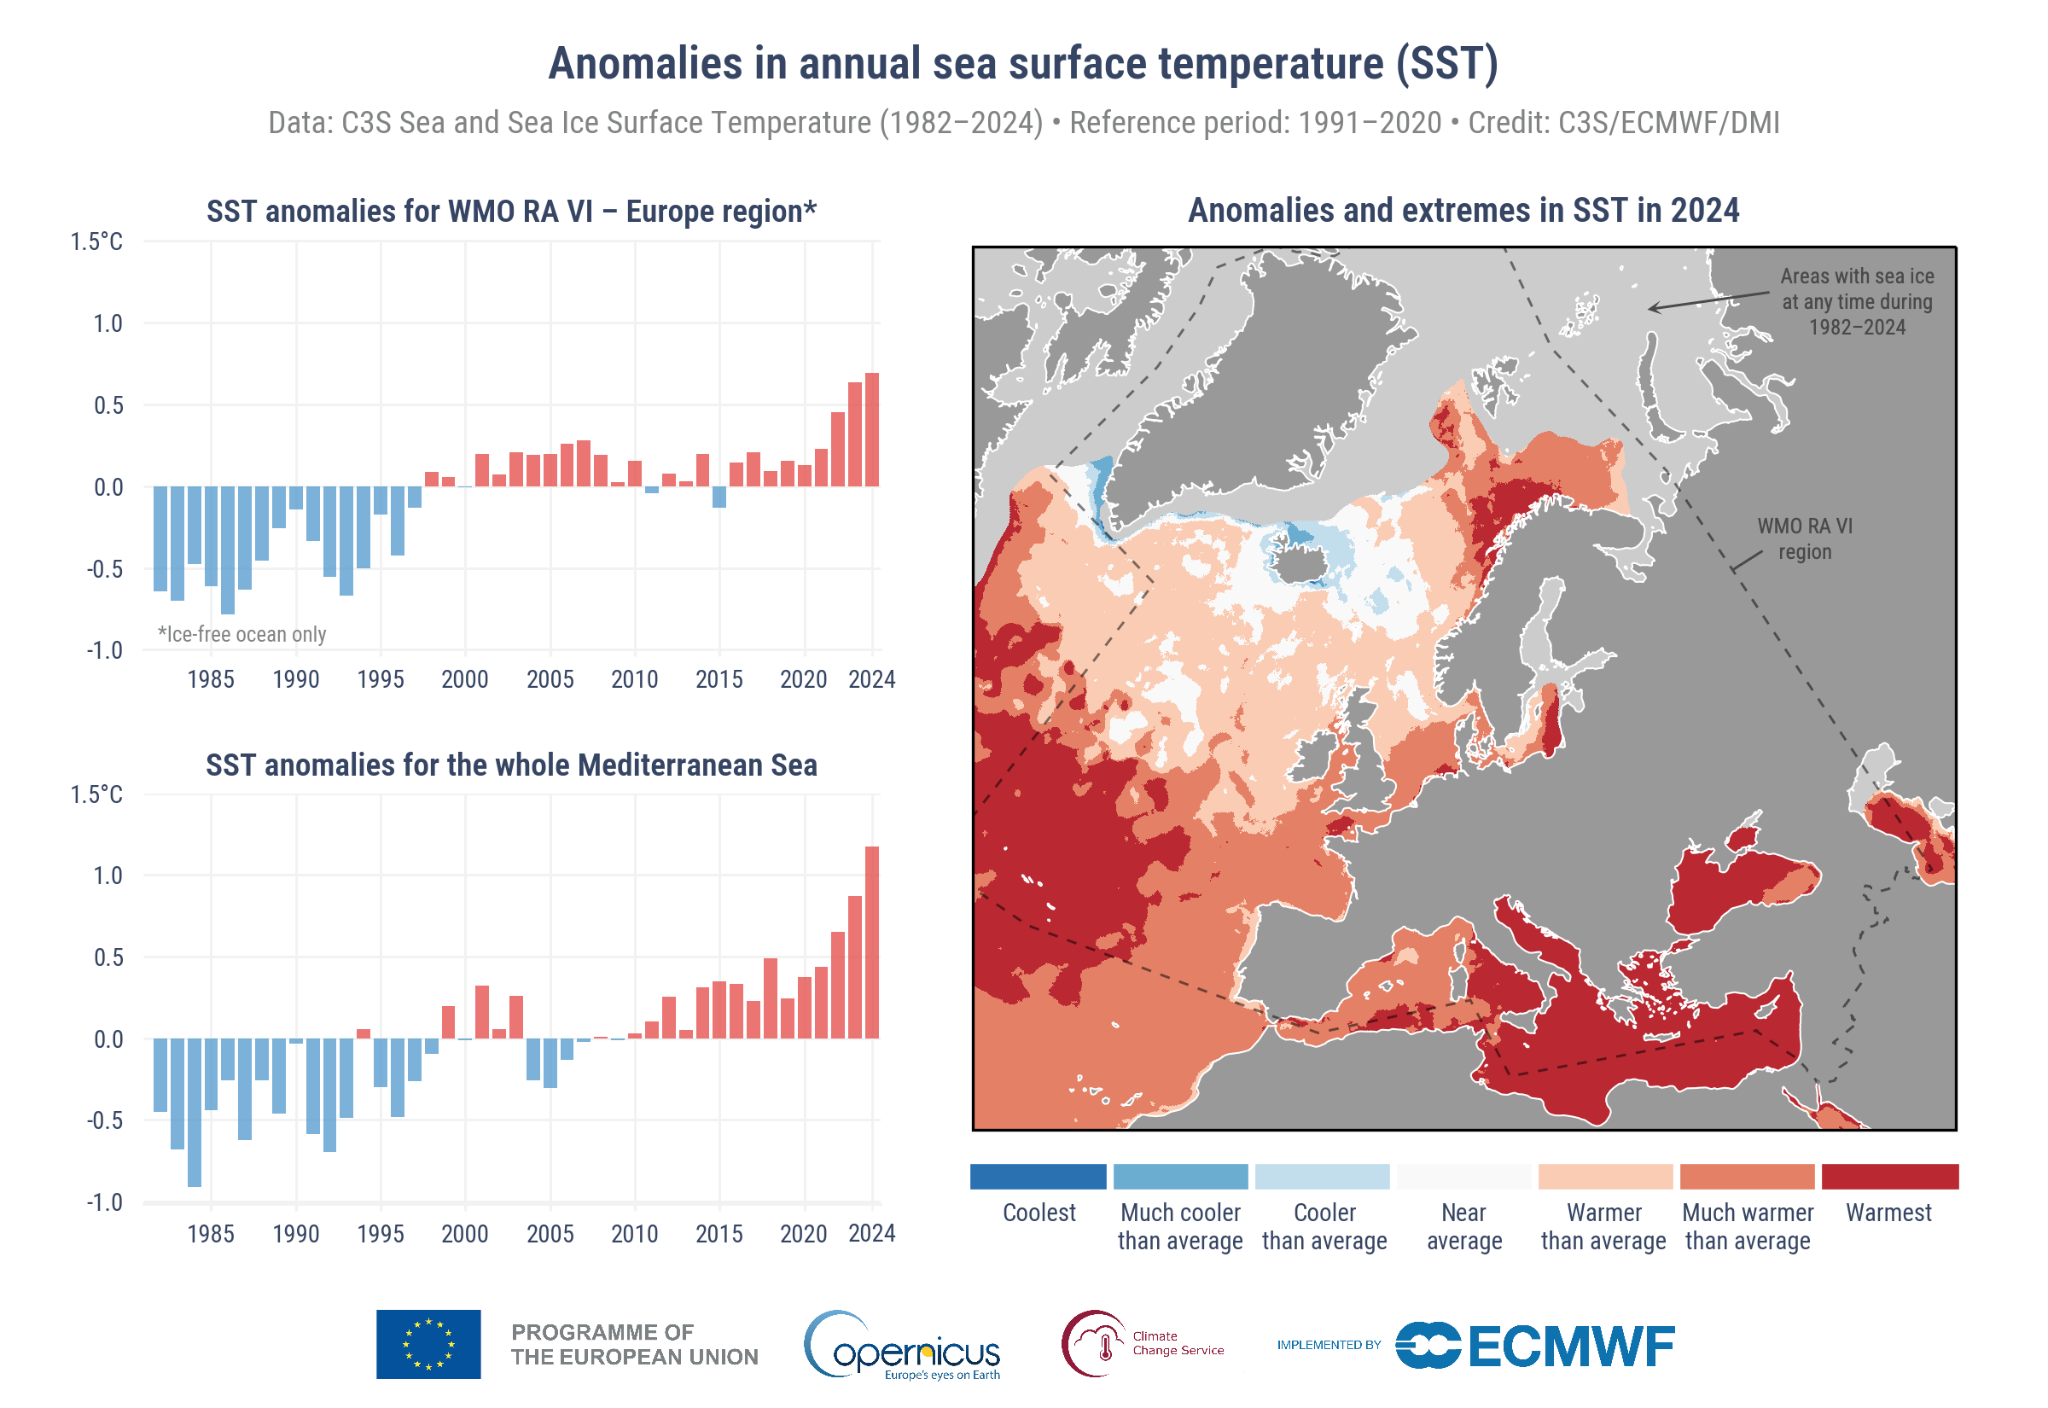
Satellite sea-surface temperature rose by approximately 0.40°C per decade over 1982–2025, with a 95% confidence interval of 0.31–0.49°C per decade. The most recent decade was about 1.36°C warmer than 1982–1991. Summer and autumn showed the strongest seasonal warming. In this record, 2024 was the warmest complete year, with an annual mean of 20.90°C and an anomaly of +1.31°C relative to 1991–2020.
The physical reanalysis also indicates warming throughout the upper 300 m. The depth-averaged trend was approximately +0.37°C per decade over 1987–2025. The 100–300 m layer accounted for about 59% of the estimated increase in heat content, partly because of its greater thickness. Surface conditions alone therefore do not describe the full accumulation of heat.
03 · A more strongly layered sea
The density contrast between the upper 0–20 m and the 100–300 m layer increased by roughly 14% between 1987–1996 and 2016–2025, mainly because of warming. Stronger stratification increases resistance to vertical mixing and can restrict exchanges between surface and deeper waters. It does not, by itself, quantify changes in circulation or dense-water formation.
The exceptional conditions of 2024 reflected a combination of inherited heat, surface heat exchange and shallow winter mixing. The heat-budget analysis does not isolate a single cause: its residual also contains transport, vertical exchanges and differences between products.
04 · Acidification and buffering
The biogeochemical reanalysis indicates a persistent decline in pH: about 0.011–0.012 pH units per decade, depending on depth. Because pH is logarithmic, this represents an increase in hydrogen-ion concentration of approximately 2.6–2.9% per decade. Acidification means a shift toward greater acidity; it does not mean that seawater has become acidic in the everyday sense of falling below pH 7.
The carbonate-system calculations also indicate weakening buffering capacity. Warming accounts for approximately 47–52% of the calculated pH decline; the remainder is non-thermal. That remainder cannot be attributed exclusively to anthropogenic carbon dioxide, because circulation and biological processes also affect the carbonate system.
Modelled aragonite saturation remained above 3 throughout the analysed offshore footprint. This is not a guarantee of biological safety or a description of every coastal habitat. Agreement between calculated and modelled pH is an internal consistency check, not independent validation against local measurements.
05 · Biological signals require care
Warmer water has a lower capacity to hold dissolved oxygen. Modelled oxygen declines were clearest in the upper 100 m, but their statistical significance depended on the period analysed. Even in 2024, the modelled concentrations were approximately 7.1–7.4 mg/L, well above the 2 mg/L hypoxia threshold. The study does not demonstrate regional hypoxia.
In 2024, the model showed reduced surface nutrients, a deeper chlorophyll maximum and lower phytoplankton carbon stocks. Yet it did not show a robust long-term decline in chlorophyll or a fall in annual primary production. Seasonal changes, turnover and model assumptions matter. These results do not establish ecological collapse, damage to Posidonia meadows or losses to fisheries.
06 · From regional evidence to local observation
The next priority is sustained monitoring that connects the regional picture to coastal conditions. The study proposes complementary stations in a human-impacted bay, on an open coast and at a deep offshore reference site. Measurements should include vertical profiles of temperature, salinity, oxygen, chlorophyll and turbidity, with additional sampling during marine heatwaves.
Reliable carbonate-system monitoring requires at least two independent variables—such as total-scale pH together with alkalinity or dissolved inorganic carbon—supported by certified standards and calibration records. Biological observations should track seagrass, plankton, calcifying organisms and fisheries. Cooperation among research institutions, local organisations and marine professionals can support this work; citizen observations complement rather than replace precision chemical measurements.
The central conclusion
The strongest evidence concerns sustained warming, increased stratification, declining pH and reduced buffering capacity. The ecological consequences need direct, repeated field observations. A useful response combines attention to these established physical and chemical changes with transparent methods, public data and explicit uncertainty.
Prepared from the supplied bilingual study, Version 1.0, 15 July 2026. This summary introduces no new analysis. Trend confidence intervals describe uncertainty within the analysed records; they do not encompass all structural uncertainties in the models. See the full study for methods, sensitivity tests and references.
Download the publications
Marangozis, B. (2026). The Changing Mediterranean — A Scientific Exploration of the Aegean and the Cyclades. Volume I. Version 1.0. Paros Sustainable Development Observatory.